The Model Manifold
Initially, thinking of modeling as a geometric problem might seem strange. However, it is actually a very natural approach to modeling and leads to some useful insights. A model is simply a function that takes parameters as inputs and makes a number of predictions. In other words, it is just a mapping from RN → RM, where the N and M are the number of parameters and predicions of the model. For any set of model parameter valeus θ, the model makes a definite set of predictions ym (m=1...M), which we can think of as a vector in an M dimensional space. If we change the parameter values by a little bit, we move to a new vector representing the new model predictions. By varying all of the parameters, the vector of model predictions sweeps out a N-dimensional hyper-surface embedded in the M-dimensional data space. This surface is the manifold of all possible model predictions, and we refer to it as the model manifold
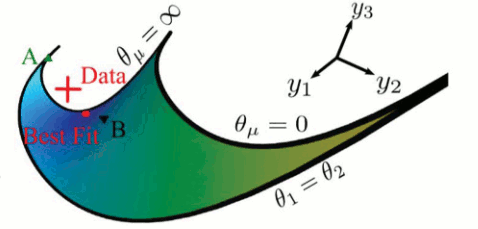 |
| The Model Manifold. A model can be viewed as a manifold embedded in data space. Here is a two parameter model fit to three data points represented as a two dimensional surface in a three dimensional space. This model has the form y = e-θ1t + e-θ2t. Notice that the model manifold has boundaries which correspond to the physical limits of the parameters, zero and infinity. Because this model has a symmetry when the parameters are permuted, there is also a boundary when they are equal. |
If experimental data is available to compare with the model predictions, then the observed data can be thought of as a single point in the data space. Fitting the model to data with least-squares is then the problem of finding the point on the model manifold that is closest to the data point. Data fitting can be interpreted as a geometric problem: How to move around on the manifold most efficiently to minimize the distance to the data.
Unlike the example in the picture, most models have more than two parameters and make more than three predictions, making it hard to visualize the model manifold. However, we can use tools from differential geometry to study the properties of these manifolds in higher dimensions. For example, in the picture, to the left, the model manifold is bounded -- parameters can be taken to extreme values such as infinity or zero, and the model still makes sensible predictions. This turns out to be a very generic feature of models with many parameters, and in higher dimensions, the boundaries have some interesting properties.
Geodesics and Widths: Hyper-ribbons
In order to explore the boundaries of model manifolds in higher dimensions, we use geodesics. Geodesics are paths on the model manifold that are the closest approxmiations to straight lines that stay on the manifold. Geodesics are exactly straight lines only if the manifold does not curve. (We use geodesics later to measure curvatures on the model manifold.) By following these geodesics from one edge of the manifold to another edge, we can get an idea of how wide the manifold is in that direction. If we do this for many directions, we begin to get an idea of what the manifold looks like in the high-dimensional space.
Widths & Sloppy Eigenvalues: Hyper-ribbons
Recall that the Fisher Information matrix for sloppy models has a very particular eigenvalue structure. This matrix turns out to have a very important function geometrically: is the metric tensor. The metric tensor tells us how much a change in the parameters will change the vector of model predictions.
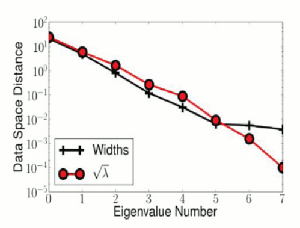 |
| Sloppy Eigenvalues and Manifold Widths. The sloppy eigenvalues accurately estimate the widths of the model manifold in their corresponding eigendirections. |
Since we were looking for a connection between geometry and sloppiness, we decided to look at the geodesics along the eigendirections of the Fisher Information. We found that the geodesic widths along each of these eigendirections formed a hierarchy very similar to the hierarchy of eigenvalues, except the ratio of the largest to the smallest width was roughly half as many orders of magnitude as the ratio of the largest to smallest eigenvalues. It turns out that the eigenvalues of the Fisher Information are related to distances squared. After taking a square root to fix the units, we found that the eigenvalues and the geodesics widths agreed almost perfectly.
Trying to visualize surfaces in high dimensions is hard. To help understand what these manifolds look like in high dimensions, consider an analogy with a three dimensional object: a ribbon. A ribbon is very anisotropic; is has a long dimension (length), a shorter dimension (width), and another even shorter dimension (height). The surfaces we see in higher dimensions seem to have these same properties, so we describe them as hyper-ribbons. Instead of having only three dimensions, however, these hyper-surfaces have many dimensions, each one a bit shorter than the last.
The observation that the widths and eigenvalues are related suggests that sloppiness is not just a consequence of our choice of parameterization of the model, but that it is reflecting something more fundamental. Although we can change the eigenvalues by changing how the model is parameterized, we cannot change the manifold's widths. The widths are an intrinsic feature of the model manifold and correspond to physically relevant limits. Numerical experiments revealed that many models have these boundaries that reflect the eigenvalues of the Fisher Information. Therefore, if we can understand why it is that model manifolds typically have a hierarchy of widths, we can understand the origin of sloppiness.
Models as Interpolation Schemes
The geodesic paths that we used to identify the widths are cross sections of the model manifold. Cross sections of a manifold correspond to surfaces formed by holding several of the model predictions fixed and varying the remaining predictions. Using this intuition, we can understand why the manifold has a hierarchy of widths and the reason so many models exhibit sloppiness.
Suppose we constraint the predictions of a model at a handful, say five, time points. This restriction reduces the dimensionality of the model by five, so there is an N - 5 dimensional set of parameter values that satisfy this constraint. Although the constraint is not enough to fix the parameter values of the model (if N > 5), it may be enough to constrain the model behavior at other times as we show in the figure below.
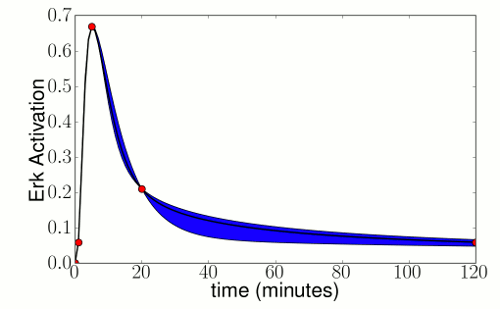 |
| Restricting Intermediate behavior and Manifold Widths. A systems biology model with 48 parameters predicts a transient level of Erk activation. If we remove 4 degrees of freedom by fixing the output of the model at times 1, 5, 20, and 120 minutes (red dots), the model still has 44 parameter combinations to determine its behavior at intermediate times. However, the actual range of model behavior at intermediate times is quite restricted (blue region). Because the intermediate behavior is restricted, the corresponding model manifold must have narrow widths. If we constrained even more predictions, the widths would become increasingly narrow. |
In the figure above, even if the model predictions at intermediate times had not been given, you would have likely been able to estimate what the model predictions at those times was. Your estimate would have been based on your intuition about the behavior of analytic functions and interpolation. In fact, we can place formal limits on the range model behavior at intermediate times using theorems about interpolation. To be specific, if we fix the output of the model at a series of n times t1, t2, ..., tn the range of behavior at some intermediate time t is bounded by
Δy(t) = (t1 - t)(t2 - t)...(tn - t) fn(ξ)/n!,
where fn(ξ) is the nth derivative of the model at some intermediate time ξ. If we look closely at the formula, we find that it involves n factors of the time point spacing: (t1 - t)(t2 - t)...(tn - t) ≈ Δ tn. If our function is analytic, then each derivative should be smaller by a factor given roughly by a characteristic length (radius of convergence) of the model: fn(ξ)/n! ≈ 1/Rn. The net result is that the range of model behavior (i.e. manifold cross section), is given by:
Δy(t) ≈ (Δt/R)n.
Using this formula, we can now explain our observation that the manifold has a hierarchy of widths. With each successive cross section (analogous to holding an additional model prediction fixed), the range of intermediate behavior decreases by a factor given by the spacing of time points and the effective time scale of the model, (Δt/R), leading to the observed geometric series.
The Origins of Sloppiness
Of course, in general models often make predictions consisting of more than a single time series. However, we believe the basic arguments we just made are still valid in more general scenarios. Whenever a model has more parameters than effective degrees of freedom in its predictions, it will be sloppy. Not only will the parameters be unconstrained, but the model manifold will form a hyper-ribbon with a hierarchy of widths.
Although parameters cannot be constrained in sloppy models, they may still make predictions by interpolating intermediate results. In general we can think of models as nothing more than a generalized interpolation scheme. In fact, we believe that this is what makes models useful in general. In more complicated scenarios it may not always be clear to the modeler which data are "near" to the predictions. It is precisely this gap that the model fills.
Is Sloppiness Intrinsic? Are Parameters Useless?
We can now answer two of the questions we asked at the beginning. Is sloppiness intrinsic? Yes. Although we can reparameterize our model to change the sloppy eigenvalues, we cannot remove the hierarchy of manifold widths which are intrinsic to the model. The observed insensitivity in the parameter eigenvalues was only reflecting this global, intrinsic sloppiness.
Are the bare parameters useless for understanding the model? No. Although the parameter values of sloppy models are unconstrained by the data, by calculating the Fisher Information of the model (which is parameterization dependent) and calculating the eigenvalues, we get an estimate of the global range of model behavior. Somehow, through the process of calculating the eigenvalues, the bare parameterization chosen by the modeler often provides deep insights about the global behavior of the model.