News and Events

Thumbnail of Regulus and the Dwarf Galaxy
In northern hemisphere spring, bright star Regulus is easy to spot above the eastern horizon. The alpha star of the constellation Leo, Regulus is the spiky star centered in this telescopic field of view. A mere 79 light-years distant, Regulus is a hot, rapidly spinning star that is known to be part of a multiple star system. Not quite lost in the glare, the fuzzy patch just below Regulus is diffuse starlight from small galaxy Leo I. Leo I is a dwarf spheroidal galaxy, a member of the Local Group of galaxies dominated by our Milky Way Galaxy and the Andromeda Galaxy (M31). About 800 thousand light-years away, Leo I is thought to be the most distant of the known small satellite galaxies orbiting the Milky Way. But dwarf galaxy Leo I has shown evidence of a supermassive black hole at its center, comparable in mass to the black hole at the center of the Milky Way.
Mount Timpanogos with sky above
Check current conditions and historical weather data at the ESC.
Image for Sommerfeldts Called as Mission Leaders
Professor Scott and Lisa Sommerfeldt in Missouri Independence Mission
Image for Adam Fennimore's Insights for Students
Alumni Adam Fennimore shares career insights for current students
Image for Society of Physics Students Awarded Outreach Grant
BYU's SPS is selected for Marsh Award for their outreach plan with Boys & Girls Club

Selected Publications

Thumbnail of figure from publication
By Mark Anderson, Kent Gee, and Jeffrey Durrant (et al.)
Abstract:

Brigham Young University has been studying questions related to NASA X-59 community noise testing. A summary of the key findings and recommendations to date are presented. Among these are weather-resistant ground microphone setups that reduce wind noise, methods for treating the problem of ambient noise contamination on sonic boom metrics and spectra, and the turbulence-induced variability seen over relatively small-aperture arrays. Also discussed are recommendations for data post-processing, e.g., employing a digital pole-shifting filter and zero-padding to improve the fidelity and smoothness of low-frequency spectral data. Finally, the relative merits of various sonic boom metrics are considered. Although Perceived Level has been the most widely-used metric, it is relatively sensitive to ambient noise contamination and turbulence-induced variability.

Thumbnail of figure from publication
By Darin Ragozzine (et al.)
Abstract:

The Vera C. Rubin Observatory is expected to start the Legacy Survey of Space and Time (LSST) in early to mid-2025. This multiband wide-field synoptic survey will transform our view of the solar system, with the discovery and monitoring of over five million small bodies. The final survey strategy chosen for LSST has direct implications on the discoverability and characterization of solar system minor planets and passing interstellar objects. Creating an inventory of the solar system is one of the four main LSST science drivers. The LSST observing cadence is a complex optimization problem that must balance the priorities and needs of all the key LSST science areas. To design the best LSST survey strategy, a series of operation simulations using the Rubin Observatory scheduler have been generated to explore the various options for tuning observing parameters and prioritizations. We explore the impact of the various simulated LSST observing strategies on studying the solar system's small body reservoirs. We examine what are the best observing scenarios and review what are the important considerations for maximizing LSST solar system science. In general, most of the LSST cadence simulations produce +/- 5% or less variations in our chosen key metrics, but a subset of the simulations significantly hinder science returns with much larger losses in the discovery and light-curve metrics.

Thumbnail of figure from publication
By Grant W. Hart, Kent L. Gee, and Mylan R. Cook
Abstract:

For many years, empirical models for rocket noise radiation relied on the directivity indices published in NASA SP-8072 (K. Eldred, 1971). Because these were known to have inaccuracies, NASA led a project to update the indices using a Space Shuttle reusable solid rocket motor (RSRM). The RSRM measurements, involving an angular arc at a radius of about 80 nozzle exit diameters, centered on the nozzle, resulted in updated directivity indices (Haynes and Kenny, AIAA 2009-3160). However, the source position is not at the nozzle, so James et al. (Proc. Mtgs. Acoust., 18, 040008, (2012)) corrected the low-frequency indices using an estimated dominant source position for each frequency. That paper was an improvement, but later measurements have shown that it also had some nonphysical results. This paper revisits that correction by using near-field vector intensity measurements from a similar, but smaller, GEM-60 motor to determine the frequency-dependent source position to adjust the apparent angles and distances of the measurements. Additionally, an effort is made to account for plume impingement downstream that likely resulted in lower high-frequency levels than would have been measured otherwise. This analysis results in updated, frequency dependent directivity indices for a large solid rocket motor.

Thumbnail of figure from publication
By Samuel David Bellows, Micah R. Shepherd, Kent L. Gee, and Timothy W. Leishman
Abstract:

The structural modes of gamelan gongs have clear connections with the gongs’ far-field radiated patterns. However, the instruments’ unique geometry and modal characteristics limit the applicability of simple theoretical models, such as a radially vibrating cap on a sphere, for understanding their radiation. This work develops and applies two different models, a vibrating cap on a spherical shell with a circular aperture and a vibrating cap with imposed mode shapes, to better understand the gongs’ directional characteristics. The models agree with acoustical measurements, predicting dipole and cardioid-like patterns and lobes formed from constructive and destructive interference.

Thumbnail of figure from publication
By Michael D. Joner (et al.)
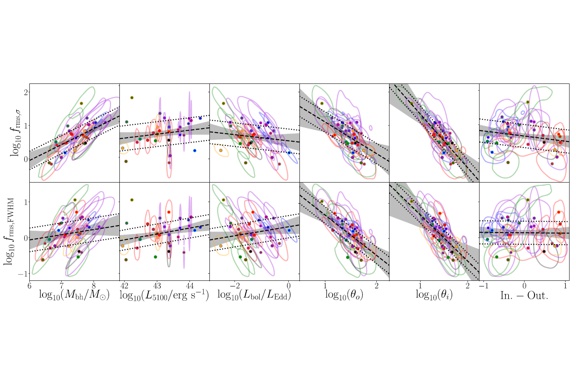
Abstract:

We combine our dynamical modeling black-hole mass measurements from the Lick AGN Monitoring Project 2016 sample with measured cross-correlation time lags and line widths to recover individual scale factors, f, used in traditional reverberation-mapping analyses. We extend our sample by including prior results from Code for AGN Reverberation and Modeling of Emission Lines (caramel) studies that have utilized our methods. Aiming to improve the precision of black-hole mass estimates, as well as uncover any regularities in the behavior of the broad-line region (BLR), we search for correlations between f and other AGN/BLR parameters. We find (i) evidence for a correlation between the virial coefficient ${\mathrm{log}}_{10}({f}_{\mathrm{mean},\sigma })$ and black-hole mass, (ii) marginal evidence for a similar correlation between ${\mathrm{log}}_{10}({f}_{\mathrm{rms},\sigma })$ and black-hole mass, (iii) marginal evidence for an anticorrelation of BLR disk thickness with ${\mathrm{log}}_{10}({f}_{\mathrm{mean},\mathrm{FWHM}})$ and ${\mathrm{log}}_{10}({f}_{\mathrm{rms},\mathrm{FWHM}})$, and (iv) marginal evidence for an anticorrelation of inclination angle with ${\mathrm{log}}_{10}({f}_{\mathrm{mean},\mathrm{FWHM}})$, ${\mathrm{log}}_{10}({f}_{\mathrm{rms},\sigma })$, and ${\mathrm{log}}_{10}({f}_{\mathrm{mean},\sigma })$. Last, we find marginal evidence for a correlation between line-profile shape, when using the root-mean-square spectrum, ${\mathrm{log}}_{10}{(\mathrm{FWHM}/\sigma )}_{\mathrm{rms}}$, and the virial coefficient, ${\mathrm{log}}_{10}({f}_{\mathrm{rms},\sigma })$, and investigate how BLR properties might be related to line-profile shape using

Thumbnail of figure from publication
Abstract:

We present reverberation mapping measurements for the prominent ultraviolet broad emission lines of the active galactic nucleus Mrk 817 using 165 spectra obtained with the Cosmic Origins Spectrograph on the Hubble Space Telescope. Our ultraviolet observations are accompanied by X-ray, optical, and near-infrared observations as part of the AGN Space Telescope and Optical Reverberation Mapping Program 2 (AGN STORM 2). Using the cross-correlation lag analysis method, we find significant correlated variations in the continuum and emission-line light curves. We measure rest-frame delayed responses between the far-ultraviolet continuum at 1180 Å and Lyα λ1215 Å ( days), N v λ1240 Å ( days), Si iv + ]O iv λ1397 Å ( days), C iv λ1549 Å ( days), and He ii λ1640 Å ( days) using segments of the emission-line profile that are unaffected by absorption and blending, which results in sampling different velocity ranges for each line. However, we find that the emission-line responses to continuum variations are more complex than a simple smoothed, shifted, and scaled version of the continuum light curve. We also measure velocity-resolved lags for the Lyα and C iv emission lines. The lag profile in the blue wing of Lyα is consistent with virial motion, with longer lags dominating at lower velocities, and shorter lags at higher velocities. The C iv lag profile shows the signature of a thick rotating disk, with the shortest lags in the wings, local peaks at ±1500 km s−1, and a local minimum at the line center. The other emission lines are dominated by broad absorption lines and blending with adjacent emission lines. These require detailed models, and will be presented in future work.